Keen.io vs Telerik Analytics (Eqatec): You Should Be Using Both
My previous post on using Keen.io + Kendo UI to create an epic dashboard brought up a question of why I’m using Keen.io instead of Telerik’s Analytics service (AKA “Eqatec”). While the two services are both in the analytics field, the aren’t really competitors at this point. Sure, you could use Keen to create the same reports that Telerik Analytics provides, but you would be writing a lot of code on your own, and manually re-recreating a lot of analytics reports. On top of that, you would be missing out on a lot of features that Telerik Analytics provides, if you were only using Keen’s services.
Ultimately asking which one you should choose is the wrong question. It’s not a matter of which one to use, but when to use either / both of them. And as you’ll see, they don’t necessarily compete with each other. Rather, I tend to see them as complimentary.
Telerik: Application Analytics And Error Tracking
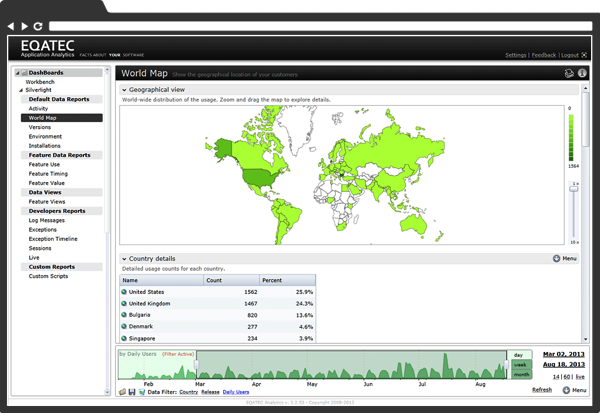
The focus of Telerik’s Analytics services is more of a back-end thing. You track application data, such as which features are used and how often, how well applications are performing, what errors you are getting (if any), and other related data. You can get information about users, such as where they are located, and other bits that come along with IP address, etc. The major benefit of all this information is not for the customer, directly. This is information that you’ll use in making decisions about your application and it’s future.
If you have a web app deployed and want to know whether or not you need to support mobile devices, for example, you have a few choices in making this decision. You could look at over-all market trends and analyze your specific target audience. This would give you a generalized idea of whether your specific market needs mobile device support. Or, you could implement Telerik’s Analytics service to gather information about your actual user base. You’ll be able to see what devices are being used, and which features those devices are using the most. This approach of measurement on your product, rather than guessing based on broad reports and generalizations, will help you understand what your product needs to focus on. You’ll be able to make decisions based on actual data, instead of conjecture.
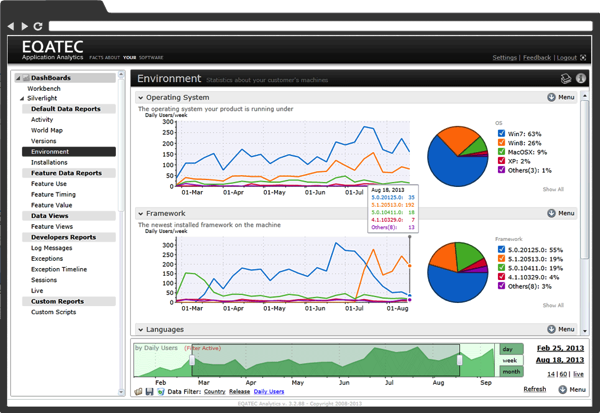
Of course there are a lot of other great reports that you’ll get out of Telerik’s Analytics, including performance analysis of your app and much more. The one thing you can’t do with Telerik is get this information from an API. You can’t call in to the Telerik Analytics site with an API key to get the data out and show it on your website. This isn’t what this service does. It gathers the info, aggregates and analyzes it, and shows you the reports through their website. Think of it like WebTrends or Google Analytics, but for any application on any platform – web, windows, iOS, Android, and so much more.
Keen.IO: Custom Events And Analytics With An API
The focus of Keen’s analytics ability is not back-end information. Instead, it provides a way to collection any event information that you want and run analytics on that information, returning it to your product / service so that you can use it where you want it. While you could technically use Keen’s service to provide the same reports and information that Telerik’s Analytics provides, I would not suggest trying to do this. You would end up writing a tremendous amount of code to capture all of the data you need, analyze it, get the geographic data from IP addresses, parse user agent strings, and otherwise make your own life miserable by trying to reproduce what Telerik provides.
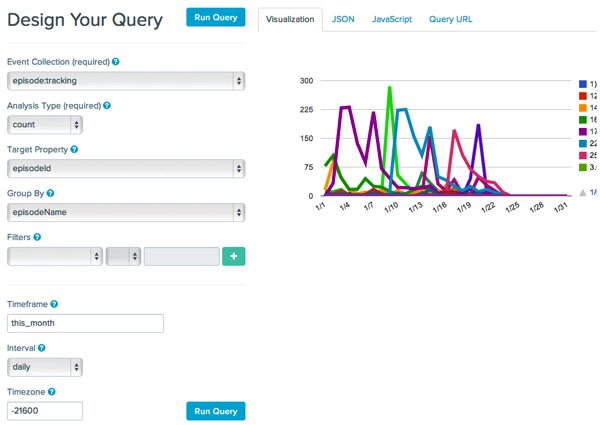
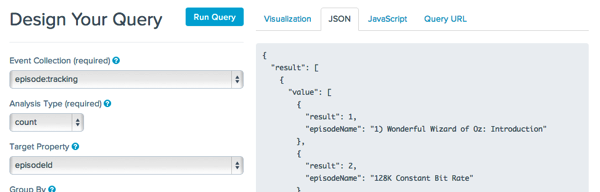
The strength of Keen’s service is in custom data and analytics for customer facing reports and dashboards, IME. SignalLeaf’s podcast and episode reports are a great example of where Keen’s services fit perfectly. I can push event data for a download or someone access the RSS feed over to Keen’s services. Once it is there, I use an API call with my API keys to have Keen run the analytics that I want, on the data that I sent over. It will aggregate, group and count stuff like no one’s business, sending the crunched numbers back to me in a JSON document.
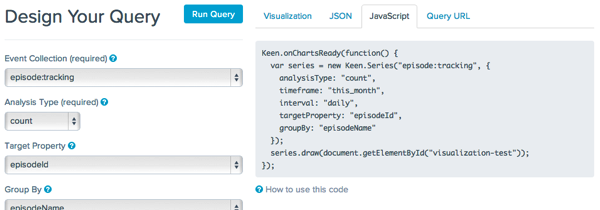
With Keen’s workbench, it’s easy to design the analytics call that you want, and then use the output options to get the graph, the JavaScript code to generate the graph on your site, the HTTP query to return the JSON document, or the raw JSON from your query.
Keen + Telerik: The Ultimate In Application Analytics
In the end, Keen’s services are focused on you providing reports and analytics to your customers. Sure, you can use it for internal data tracking as well. There is no reason not to do this. You may need reports that you don’t want your customers to have, after all. Telerik Analytics, on the other hand, are meant to be an administrative, back-end tool that helps you understand your customers and your application use. It will give you information that you can use to determine which parts of your system need to be enhanced, removed, modified, etc.
While it may look like Keen.io and Telerik Analytics are in competition, at first, I don’t believe they are. These two analytics services provide different feature sets for different purposes. The combination of the two, then, is going to be powerful. Use Keen’s services when you need custom reports and analysis. Use Telerik Analytics when you want to know which parts of your app are being used, what errors are being thrown (if any), where your user base is, etc.