Writing a profiler for Silverlight applications – Part 2
Introduction
Unfortunately there doesn’t yet exist any decent profiler for Silverlight applications. This fact inspired me to write my own profiler which is able to profile any member of any assembly of our solution and help me track down performance bottlenecks and other potential problems of our applications.
In part one of this post series I showed how we can use Mono Cecil to instrument any (compiled) assembly and thus prepare it for being profiled. In this second part I want to discuss what data we collect as well as how we collect the data. And finally we show a way how to dump the data generated by the profiler to a pre-defined output where it can be used for further analysis. The analysis part of the profiler I will discuss in part 3 of the post series.
What data to collect
Instrumenting an assembly is one thing but the other important thing is to collect meaningful data. Profiling is all about how the application behaves during run time and how the various operations perform.
Each application has a well defined single entry point which is called by the assembly loader upon start of the application. Starting from this entry point or start method other methods are called which in turn call again other methods. In the end we have a tree of calls. Thus our data structure must also be a tree structure.
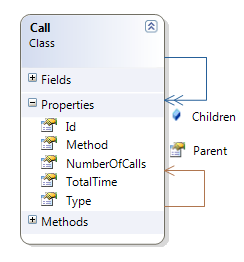
I have defined a class Call which contains all data I want to collect for a single node of my call tree. Each call has a unique id and a collection of child nodes of type Call. For easier navigation I also provide a backward link to the parent of each call that is to its caller.
For each method(or call) I register the total time spent inside this method as well as the type in which this method is defined and the meta information of the current method. I also register the number of times a method is called by its parent.
Certainly there might be other interesting data to collect, but for our purposes this was enough.
Running the instrumented application
Please be aware that a fully instrumented application produces a huge amount of profiling data. In our case running the application for only a couple of seconds produced several 10 thousands of nodes. Also be aware that profiling an application has a significant impact on its performance. I strongly advise that you do not use this profiler or this technique in production but only on your developer machine or on a test system.
Intercepting the method calls
In the first part of this post series I have shown how we can instrument any assembly with the aid of Mono Cecil such as that any method call in the respective assembly can be intercepted. In our case I just inserted a call to an external profiler class at the beginning and at the end of each method.
The code inserted at the beginning of each method was
ProfileInfoTracker.WhenEnteringMethod();</p>
and the one at the end
ProfileInfoTracker.WhenLeavingMethod();</p>
Let’s now analyzed the code inside those methods. First the WhenEnteringMethod
public static void WhenEnteringMethod()
{
var timeIn = DateTime.Now;
var method = GetCallingMethod();
var parentCall = Stack.Count > 0 ? Stack.Peek() : RootCall;
Call call = null;
if (parentCall.Children.ContainsKey(method))
{
call = parentCall.Children[method];
}
else
{
call = new Call
{
Type = method.ReflectedType,
Method = method,
};
parentCall.Children.Add(method, call);
}
call.NumberOfCalls++;
call.SetEnterTime(timeIn);
Stack.Push(call);
}</p>
As the very first operation we save the current time and then we determine the MethodBase (meta information) of the method that called us. We use the StackFrame class to provide us this information.
private static MethodBase GetCallingMethod()
{
var StackFrame = new StackTrace();
return StackFrame.GetFrame(2).GetMethod();
}</p>
By using our internal stack we are now able to retrieve the caller of the intercepted method. We call this the parent call. If there is no call on the stack we are obviously at the very beginning of the call chain and thus we return the root call object.
Now it is possible that the parent call calls another method more than once. If so then its children collection would already contain this call and thus we have to use it. Otherwise we create a new call object and store it in the parent calls children collection. When defining a new call object we provide it the MethodBase object as well as the Type in which the method is defined. We also increase the number of calls to this specific method and set the recorded enter time. Finally we push the call object onto our stack.
The second method is rather trivial
public static void WhenLeavingMethod()
{
var call = Stack.Pop();
call.SetLeaveTime(DateTime.Now);
}</p>
we just pop the current call from the stack and feed it with the current time which defines the method exit time. That’s all!
Multi threaded applications
Unfortunately we are not done yet. There is one little call in the above code that hides some complexity. It is the RootCall and the Stack property. The logic inside the property getter is
public static Call RootCall
{
get
{
if(rootCall == null) rootCall = new Call();
return rootCall;
}
}</p>
for the root call and for the stack it is
private static Stack<Call> Stack
{
get
{
if(stack == null)
stack = new Stack<Call>();
return stack;
}
}</p>
As you can see these are just two lazy instantiated properties but in this case it is important since we deal with a multi threaded application. We define the rootCall field as follows
[ThreadStatic]
private static Call rootCall;</p>
in a similar way we define our internal stack
[ThreadStatic]
private static Stack<Call> stack;</p>
Please note the [ThreadStatic] attribute on the two fields. This attribute guarantees us that we collect the data for each thread separately. The attribute defines that the corresponding static fields are not globally static but only static per thread. In a subsequent part of this series I will discuss the code modifications needed to retrieve the profiling data for all threads. At the moment we are only interested in the profiling data of the main thread (i.e. the UI thread).
Retrieving the profiling data
In a Silverlight application the possibility to store data in the file system of the client are rather limited. This is by design due to security reasons. In our case we decided to provide a special key combination to the Silverlight client which will then dump the profiling data as an xml document to a textbox in a popup dialog. From there we can copy the output to any text editor (e.g. Notepad++), manipulate it if needed and save it to the file system.
In the startup event handler we attach the Silverlight Profiler to the key down event of the root visual
private void Application_Startup(object sender, StartupEventArgs e)
{
...
RootVisual.KeyDown += (s,e) => SilverlightProfiler.OnKeyDown(s, e);
...
}</p>
The OnKeyDown method contains the following code
public static void OnKeyDown(object sender, KeyEventArgs e)
{
if (e.Key == Key.Y && CtrlPressed() && ShiftPressed())
ProfileInfoTracker.ToggleProfilingOnOff();
else if (e.Key == Key.Z && CtrlPressed() && ShiftPressed())
{
var sb = new StringBuilder();
var writer = new StringWriter(sb);
ProfileInfoTracker.DumpProfile(writer);
HandleOutput(sb.ToString());
}
}</p>
With the key combination CTRL-SHIFT-Y we can start and stop profiling whereas with the combination CTRL-SHIFT-Z we can dump the profiler output to the defined output.
The HandleOutput method opens a modal dialog which contains a textbox into which we write the profiler output.
private static void HandleOutput(string output)
{
var modalDialog = new ModalDialog();
modalDialog.Show(output);
}</p>
The custom designed ModalDialog class is using the Popup class of Silverlight to display a dialog like window on top of the browser.
Summary</p> </p> </p> </p> </p> </p>
In our company we have implemented a Silverlight profiler to be able to track performance bottlenecks and other potential problems in our solution. In part two of this post series I have show you what data we collect with our profiler and how we collect this data. Furthermore I have discussed a possible way to extract the profiling data for further use in a analysis tool which I will discuss in part three of this series.