Visualizing LINQ expressions in the debugger
In Ben’s recent post on Fluent Route Testing in ASP.NET MVC, he recalled a problem we had when trying to figure out how to deal with an Expression<> once we have one. Typically, I like to parse the Expression to get at some reflection information, whether it’s to look at model members for DTO mapping or specifying controller actions. Expression<> is very helpful for strongly-typed reflection, but the underlying type can be a pain to deal with. The base Expression type has quite a few derived types to deal with:
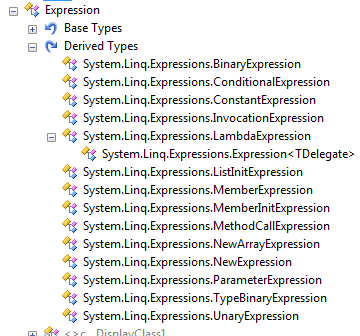
What makes things worse is that the ExpressionType property, which you’re supposed to inspect, doesn’t match up in the least to the individual child Expression types. There are forty-something ExpressionType enum values, from things like “ExclusiveOr” to “SubtractChecked” to “Coalesce”. It’s mainly trial-and-error to understand how a given lambda expression would translate into an Expression tree. As Ben noted, I just broke in the debugger and expanded down and down until I saw what I needed.
As I read it this morning, I wondered, “why isn’t there a LINQ expression debugger visualizer”? This is what keeps me up at night, very sad. Some crack investigation (Google) showed me that there are two nice ones out there already. The first is a debugger visualizer that comes with Visual Studio’s samples. You can find it in the C# samples in
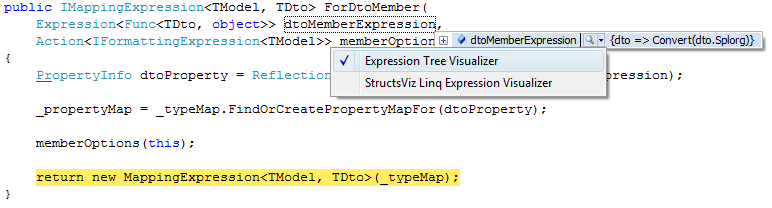
The other nice visualizer, which is a little prettier, is Manuel Abadia’s visualizer. The interesting aspect of debugger visualizers is that you can install as many as you like, and pick which one to view using the little magnifying glass:
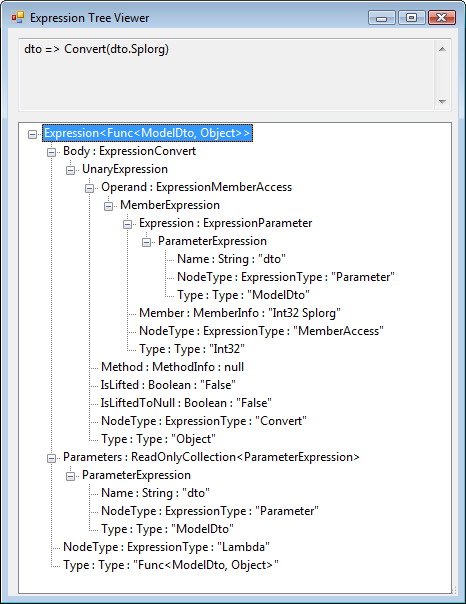
Clicking on the first sample visualizer brings up a nice TreeView control:
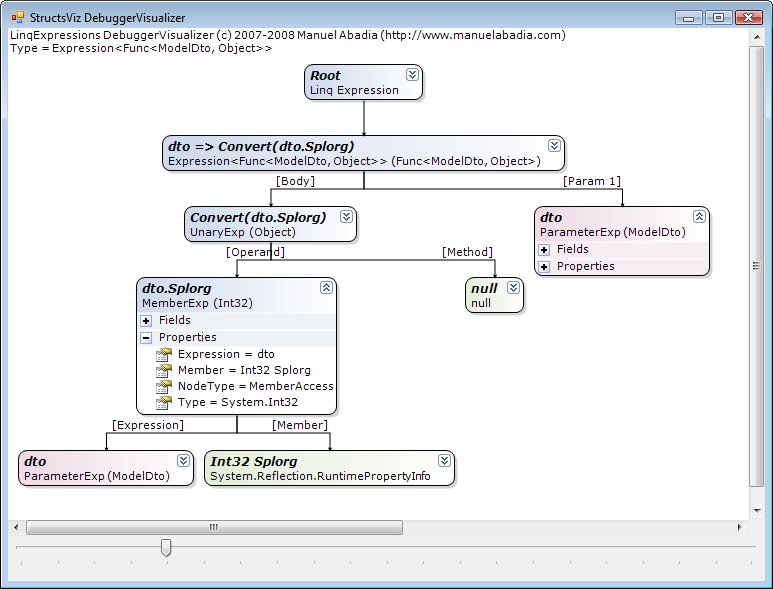
Or, clicking on the second choice brings up the prettier, StructsViz visualizer:
Along with the VisualStudio visualizer sample is a stand-alone console/WinForms application, which is nice as the debugger visualizer is a modal dialog that you can’t keep around for further development. Once you’re done debugging, the visualizer goes away. But, it’s still better than manually expanding the normal object debug visualizer.