Analyzing AutoMapper performance
One of the last things I wanted to look at AutoMapper before pushing it out to production was to get some idea of how it performed. One of the more difficult things in doing this is trying to come up with a good idea of what exactly I should measure. Especially with performance numbers, measuring them will lead you to improve them, so it’s important that what you measure is representative of how it will actually be used.
The other tough thing in looking at performance was trying to figure out what a good number is. Cost to improve performance (where cost is basically a lazy Sunday for me) increases exponentially as I improve a measurement. It might be trivial to increase a metric by 75%, but it might take four times as long to increase it another 75%. And at that point, I may only be able to squeeze another 10% improvement, which only represents an additional 0.625% improvement on the original time. So at some point, I’ll probably stop caring. But until then, I can still find some easy bottlenecks to improve.
Setting up the profiling
Going in, I knew that reflection wasn’t the bottleneck. Before I started looking at performance (around the 0.3.0 release), all mapping was done via old-school reflection. Instead, I figured that I just needed some caching of decisions and whatnot. But before I could profile, I needed a decent scenario. For this, I looked at a reasonably complex flattening scenario, mapping these set of complex types:
public class ModelObject
{
    public DateTime BaseDate { get; set; }
    public ModelSubObject Sub { get; set; }
    public ModelSubObject Sub2 { get; set; }
    public ModelSubObject SubWithExtraName { get; set; }
}

public class ModelSubObject
{
    public string ProperName { get; set; }
    public ModelSubSubObject SubSub { get; set; }
}

public class ModelSubSubObject
{
    public string IAmACoolProperty { get; set; }
}
To this flattened out DTO type:
public class ModelDto
{
    public DateTime BaseDate { get; set; }
    public string SubProperName { get; set; }
    public string Sub2ProperName { get; set; }
    public string SubWithExtraNameProperName { get; set; }
    public string SubSubSubIAmACoolProperty { get; set; }
}
I’m not terribly interested in the initialization time at this point (though I will look at it, eventually), so I just put into a loop calling AutoMapper about 100K times. I fiddled with this number a bit until I found a number where I wouldn’t get bored waiting. The profiling code is rather boring, but it’s in the trunk if you’re interested.
Initial results
Much like I assumed, the actual time spent doing reflection was a small, but sizable percentage of performing a mapping operation:

Much of the time is spent making the decision of how to do the mapping. Because AutoMapper works by mapping based on source/destination type pairs, it has to decide what to do based on each pair. It turns out that the auto-mapped functionality of AutoMapper is only one of about a dozen different mapping algorithms to choose based on a source/destination type pair. Things like arrays, lists, dictionaries, enumerations, etc. all have their own mapping algorithm.
To get the times down, all it really took was analyzing the calls and figuring out where results can be stored and not precalculated.
Note: If I was halfway-decent with funtional programming, this could be a memoized function. But, I digest.
The reflection part is still bad, as I see it, but still not too shabby. But, it can be improved.
Tracking the improvements
The initial review of performance was about 40 something commits ago, so I wanted to get an idea of how performance has changed over time. The results are quite interesting:
| Revision | Time (ms) |
| 70 | 30951 |
| 75 | 11138 |
| 80 | 7901 |
| 85 | 7833 |
| 90 | 7934 |
| 95 | 8060 |
| 100 | 9412 |
| 105 | 9965 |
| 110 | 10088 |
| 113 | 8214 |
So time dropped precipitously after 10 revisions of tweaking and caching, and steadily increased as I added other features (and other non-cached decisions). Then recently, I pushed the time back down again. So what went into these fixes?
- Caching decisions in dictionaries, usually based around types. Decisions, once made for a type, do not change for the most part
- Switching to compiled expression trees for reading values, instead of reflection
- Switching to IL generation through DynamicMethod for writing values, instead of reflection
At this point, actually reading and writing information is a tiny fraction of what AutoMapper needs to do:
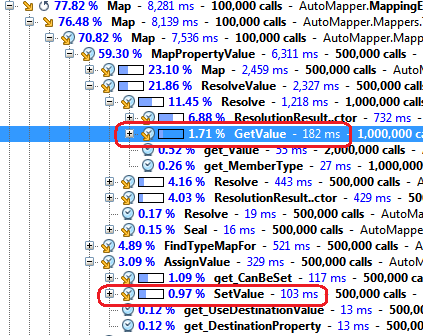
Only about 2.6% of the mapping operation is actually performing the mapping, by ditching reflection. So not only has the entire mapping operation gotten faster, the reflection code is down to a point where it’s nowhere near the bottleneck.
Final numbers
Before making any enhancements, the benchmark I used compared hand-rolled mapping with AutoMapper. Before, AutoMapper took around 15 seconds what hand-rolled mappings take in about 15 milliseconds. That’s a rather large difference, three orders of magnitude difference. After enhancements, mapping is around 2 seconds, or almost an order of magnitude improvement.
Now, these numbers by themselves aren’t nearly as interesting as putting them in a real application. When I profiled our application under load, it was of course the database being the bottleneck. Focusing solely on AutoMapper to improve performance is local optimization, it’s not the bottleneck in our typical application usage.