Great time to be a developer
I am in awe of the free tools available to software developers today. It is amazing how fast, and cheaply, you can turn an idea into productive code. I was so pumped by a recent experience, I decided to share.
The Problem
My employer is moving to a new location in a part of the city that I’m not very familiar with. I have no idea what the traffic patterns are like, and I’m wondering when to leave for work in the morning. I tried looking at various web mapping services. Some factor in current traffic, but I couldn’t find any that could tell me historical traffic information, making it impossible to make a decision about departure time in advance.
Idea
Tracking historical travel times for the world would be a huge task, but what if I could create a small history of my specific route? The TomTom Live Traffic Route Planner site can give me directions to work, and estimate travel time based on current traffic conditions. I discovered that it returns a lot of the trip information from a single AJAX call. A quick copy/paste of the URL to curl confirmed that I could repeat the call and get the same data. I just need to hit that endpoint at various times in the morning and store the results. Later, I’ll be able to analyze the results and determine the best time to leave for work.
Keep it Minimal
Now I have an idea, but I don’t know if it is worth pursuing. I don’t know if the data I’m getting is accurate (it worked once or twice from curl now, but maybe the long URL contains some session id that will expire?). I don’t want to invest a lot of time or money in building it out. Also, it’s 6pm Tuesday night, I only have 3 more days left this week before I make the commute to the new office. I need to start collecting data as soon as possible; hopefully Wednesday morning. It’s time to write some code. Fast.
This is where the quality of available tools really make an impact. To name a few:
Ruby – low ceremony scripting with a vast ecosystem of libraries to accomplish common tasks.
HTTParty – crazy simple library to call a URL and get a Ruby hash of the response data – no parsing, no Net:HTTP.
Heroku – There is no better option for hosting applications in the early proving stage. Create and deploy a new app in seconds, for free. The free Heroku Scheduler add-on lets me run a script every 10 minutes in my hosted environment — exactly what I need for my data collection.
MongoDB – natural fit for persisting an array (the trips calculated every 10 minutes) of ruby hashes (responses from traffic service). No schema, no mapping, no fuss.
MongoLabs – free MongoDB hosting on Heroku. One click to add, and I have a connection string for my own 240MB in the cloud. Sweet.
By 11pm Tuesday night, my script is running in the cloud, ready to start collecting data Wednesday morning. I’m not going to spend any time on building a UI until I know if the data collection works.
Checkpoint
On Wednesday night, I use the mongo console to review the trip data that was collected in the morning. I see that the trip duration changes for each request, which gives me hope that I’ll have meaningful data to answer my question. However, I also notice that the reported “traffic delay” time is always zero. I’m a little concerned that my data source isn’t reliable. I’m glad I haven’t invested too much yet. At this point, I can just write off the time as a well-spent refresher of MongoDB.
Further exploration
I’m still curious to see a visualization of the data. I decide to spend a couple hours to see if I can build a minimal UI to chart the departure vs. duration times. Again, the available tools gave me fantastic results with minimal effort:
sinatra – an incredibly simple DSL for exposing your ruby code to the web. All I needed was a single endpoint that would pull data from mongo and dump it to the client to render a chart. Anything more than sinatra would be overkill, and anything less would be tedious.
Highcharts JS – amazing javascript library for generating slick client-side charts. A ton of options (including the very helpful datetime x-axis), well-documented, and free for non-commercial use. I didn’t have a “go-to” option for client-side charting, so I had to do a quick survey of what was available. This is the first one I tried, and it left me with absolutely no reason to look at others.
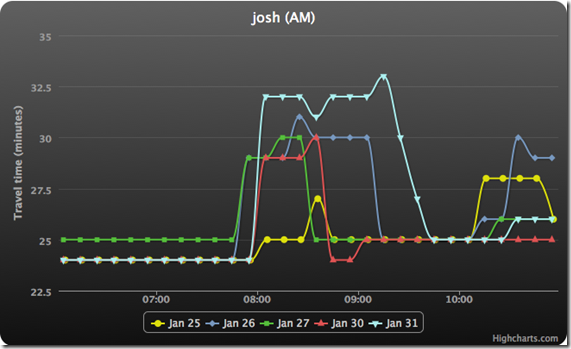
After a couple hours (mostly to learn Highcharts), I have my chart and a potential answer (leave before 7:45, or after 9):

Conclusion
I essentially spent one evening writing the data collection script, and another night building the web page that rendered the chart. I’ve proven to myself that the idea was sound, if not the data source. I will continue to poke around to see if I can find a more reliable API for travel times, but otherwise consider this project “done.” In years past, getting to this point would have meant a lot more effort on my part. It is awesome how much of the hard work was done by the people and companies that support a great developer ecosystem.
