Writing a profiler for Silverlight applications – Part 1
</p>
In this article I want to discuss the steps needed to instrument a Silverlight assembly such as that it can be profiled. To achieve this task I use Mono Cecil, a library from the Mono platform which is an open source implementation of .NET.
Introduction
In my company we have a very complex Silverlight application. This application is highly dynamic and fully asynchronous. Lately we encountered some performance problems on slower PCs. Unfortunately there doesn’t yet exist any decent profiler for Silverlight applications. Since – as I already mentioned – our application is rather complex it is difficult to impossible to analyze this application thoroughly without a good profiling tool. We have tried various ways to track down the problems by e.g. manually adding trace code or by writing profiling interceptors for all our classes that are registered in the IoC container. With this methods we were able to track some hotspots but these were only the tips of an iceberg.
While discussing with a coworker who showed me what he is doing with the aid of the Mono Cecil library I suddenly realized: “I can write my own profiler!”.
This is my first project using the Mono Cecil library. In this project we only need the Mono.Cecil.dll assembly.
Please note that the techniques presented here can be used for any type of assembly and are not restricted to Silverlight assemblies.
First Step – discovering all types and its members
I want visit all members of all my types in the assembly that I want to instrument for profiling purposes. The first code snippet I use to test my intent is
public void Parse(Assembly assembly)
{
var assemblyDef = AssemblyFactory.GetAssembly(assembly.Location);
Console.WriteLine("Assembly {0}", assemblyDef.Name);
foreach (TypeDefinition type in assemblyDef.MainModule.Types)
{
if (type.Name == "<Module>") continue;
Console.WriteLine("Type {0}", type.Name);
foreach (MethodDefinition method in type.Methods)
{
Console.WriteLine("Method {0}", method.Name);
}
}
}
.csharpcode, .csharpcode pre
{
font-size: small;
color: black;
font-family: consolas, “Courier New”, courier, monospace;
background-color: #ffffff;
/*white-space: pre;*/
}
.csharpcode pre { margin: 0em; }
.csharpcode .rem { color: #008000; }
.csharpcode .kwrd { color: #0000ff; }
.csharpcode .str { color: #006080; }
.csharpcode .op { color: #0000c0; }
.csharpcode .preproc { color: #cc6633; }
.csharpcode .asp { background-color: #ffff00; }
.csharpcode .html { color: #800000; }
.csharpcode .attr { color: #ff0000; }
.csharpcode .alt
{
background-color: #f4f4f4;
width: 100%;
margin: 0em;
}
.csharpcode .lnum { color: #606060; }
The above code uses the Mono.Cecil assembly and just prints all members of all types of the assembly passed as a parameter to the method. I specifically want to verify that even private methods and automatic properties are discovered correctly. Please note that a property is nothing else than a pair of a setter and a getter method. The type I am analyzing is defined as follows
public class TestClass
{
    public TestClass()
    {
        Console.WriteLine("Constructor of TestClass");
    }

    public void PublicVoidFunction()
    {

    }

    protected int ProtectedIntFunction()
    {
        return 0;
    }

    private decimal PrivateDecimalFunction()
    {
        return 1.0m;
    }

    public string AutomaticProperty { get; set; }

    private string standardProperty;
    public string StandardProperty
    {
        get { return standardProperty; }
        set { standardProperty = value; }
    }
}
.csharpcode, .csharpcode pre
{
font-size: small;
color: black;
font-family: consolas, “Courier New”, courier, monospace;
background-color: #ffffff;
/*white-space: pre;*/
}
.csharpcode pre { margin: 0em; }
.csharpcode .rem { color: #008000; }
.csharpcode .kwrd { color: #0000ff; }
.csharpcode .str { color: #006080; }
.csharpcode .op { color: #0000c0; }
.csharpcode .preproc { color: #cc6633; }
.csharpcode .asp { background-color: #ffff00; }
.csharpcode .html { color: #800000; }
.csharpcode .attr { color: #ff0000; }
.csharpcode .alt
{
background-color: #f4f4f4;
width: 100%;
margin: 0em;
}
.csharpcode .lnum { color: #606060; }
and the output generated is
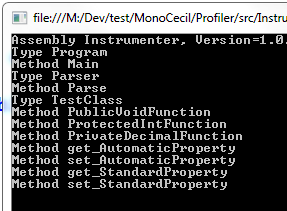
We can immediately see that everything is listed as expected except for the constructor. How can I get hold on the constructor? It turns out that the type definition does have a constructors collection which provides me exactly the information needed
.csharpcode, .csharpcode pre
{
font-size: small;
color: black;
font-family: consolas, “Courier New”, courier, monospace;
background-color: #ffffff;
/*white-space: pre;*/
}
.csharpcode pre { margin: 0em; }
.csharpcode .rem { color: #008000; }
.csharpcode .kwrd { color: #0000ff; }
.csharpcode .str { color: #006080; }
.csharpcode .op { color: #0000c0; }
.csharpcode .preproc { color: #cc6633; }
.csharpcode .asp { background-color: #ffff00; }
.csharpcode .html { color: #800000; }
.csharpcode .attr { color: #ff0000; }
.csharpcode .alt
{
background-color: #f4f4f4;
width: 100%;
margin: 0em;
}
.csharpcode .lnum { color: #606060; }</p>
foreach (MethodDefinition method in type.Constructors)
{
    Console.WriteLine("Constructor {0}", method);
}
.csharpcode, .csharpcode pre
{
font-size: small;
color: black;
font-family: consolas, “Courier New”, courier, monospace;
background-color: #ffffff;
/*white-space: pre;*/
}
.csharpcode pre { margin: 0em; }
.csharpcode .rem { color: #008000; }
.csharpcode .kwrd { color: #0000ff; }
.csharpcode .str { color: #006080; }
.csharpcode .op { color: #0000c0; }
.csharpcode .preproc { color: #cc6633; }
.csharpcode .asp { background-color: #ffff00; }
.csharpcode .html { color: #800000; }
.csharpcode .attr { color: #ff0000; }
.csharpcode .alt
{
background-color: #f4f4f4;
width: 100%;
margin: 0em;
}
.csharpcode .lnum { color: #606060; }
Now it will be interesting to know if I can also discover anonymous functions since we use them very intensively in our code base. It is thus absolutely mandatory to also instrument those functions. And it turns out that Cecil indeed discovers them. If I have the following method call
MethodWithAFunctionParameter(i =>
                                 {
                                     var random = new Random((int) DateTime.Now.Ticks);
                                     return i < random.Next(100);
                                 });
.csharpcode, .csharpcode pre
{
font-size: small;
color: black;
font-family: consolas, “Courier New”, courier, monospace;
background-color: #ffffff;
/*white-space: pre;*/
}
.csharpcode pre { margin: 0em; }
.csharpcode .rem { color: #008000; }
.csharpcode .kwrd { color: #0000ff; }
.csharpcode .str { color: #006080; }
.csharpcode .op { color: #0000c0; }
.csharpcode .preproc { color: #cc6633; }
.csharpcode .asp { background-color: #ffff00; }
.csharpcode .html { color: #800000; }
.csharpcode .attr { color: #ff0000; }
.csharpcode .alt
{
background-color: #f4f4f4;
width: 100%;
margin: 0em;
}
.csharpcode .lnum { color: #606060; }
This anonymous function is discovered and output as follows
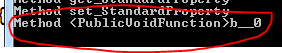
The first part of the name
Second step – Injecting instrumentation code
Ok, now I have everything to start with my instrumentation. This will be the harder part since I have to inject some code into every discovered method. The code has to be in MSIL. I will have some code at the beginning of each method and some at the end of each method. I will call the former pre-invocation code and the latter post-invocation code.
To avoid any unnecessary complexity my pre- and post-invocation code should be as simple as possible. Thus I decided to just make a parameter less call to a (static) method of a specific class. This class will contain all logic needed to profile my application. In my sample I call this class ProfileInfoTracker and the static methods I want to call are WhenEnteringMethod and WhenLeavingMethod.
Thus each instrumented method of my assembly will look like this void sample function
public void PublicVoidFunction()
{
ProfileInfoTracker.WhenEnteringMethod();
// user code...
ProfileInfoTracker.WhenLeavingMethod();
}</p>
or this function returning a result
protected int ProtectedIntFunction()
{
ProfileInfoTracker.WhenEnteringMethod();
// user code...
// ...
result = ...
ProfileInfoTracker.WhenLeavingMethod();
return result;
}</p>
Before fumbling around with IL code I implemented a reference method including the pre- and post-invocation code in C# and compiled it. Then I analyzed the output in Reflector.
This is the method I analyzed in C#
public void PublicVoidFunction()
{
ProfileInfoTracker.WhenEnteringMethod();
Random random = new Random((int) DateTime.Now.Ticks);
Thread.Sleep(random.Next(50));
ProfileInfoTracker.WhenLeavingMethod();
}</p>
and this is the very same method in IL code
.method public hidebysig instance void PublicVoidFunction() cil managed
{
.maxstack 3
.locals init (
[0] class [mscorlib]System.Random random,
[1] valuetype [mscorlib]System.DateTime time)
L_0000: call void Instrumenter.ProfileInfoTracker::WhenEnteringMethod()
L_0005: nop
L_0006: call valuetype [mscorlib]System.DateTime [mscorlib]System.DateTime::get_Now()
L_000b: stloc.1
L_000c: ldloca.s time
L_000e: call instance int64 [mscorlib]System.DateTime::get_Ticks()
L_0013: conv.i4
L_0014: newobj instance void [mscorlib]System.Random::.ctor(int32)
L_0019: stloc.0
L_001a: ldloc.0
L_001b: ldc.i4.s 50
L_001d: callvirt instance int32 [mscorlib]System.Random::Next(int32)
L_0022: call void [mscorlib]System.Threading.Thread::Sleep(int32)
L_0027: nop
L_0028: call void Instrumenter.ProfileInfoTracker::WhenLeavingMethod()
L_002d: ret
}</p>
The interesting parts for me are the two lines at L_0000 and L_0028. I will have to use Mono Cecil to inject those statements in each and every method of the assembly I want to instrument.
It turns out that there is a very limited amount of documentation available for Mono Cecil. This made my start a little bit slow. But after I waded through those upfront difficulties the usage is straight forward.
I can create such an IL call instruction with the following code
private Instruction CreateCallInstruction(CilWorker worker, string methodName)
{
var methodInfo = typeof(ProfileInfoTracker).GetMethod(methodName);
var methodReference = assembly.MainModule.Import(methodInfo);
return worker.Create(OpCodes.Call, methodReference);
}</p>
the above method has two parameters. The first one is the CIL worker object which I can get for via the MethodReference of the method I am currently instrumenting
var worker = methodReference.Body.CilWorker;</p>
The second parameter is the name of the method I want to call on the target class which in our case is just the ProfileInfoTracker class.
With the aid of the CIL worker I can the create my desired IL call instruction (the WhenEnteringMethod and well as the WhenLeavingMethod call).
To instrument the current method I can now use the following code
private void InstrumentMethod(MethodDefinition method)
{
AddPreInvocationCode(method);
AddPostInvocationCode(method);
}
private void AddPreInvocationCode(MethodDefinition method)
{
var worker = method.Body.CilWorker;
var callMethod = CreateCallInstruction(worker, "WhenEnteringMethod");
var lastInstruction = method.Body.Instructions[0];
worker.InsertBefore(lastInstruction, callMethod);
}
private void AddPostInvocationCode(MethodDefinition method)
{
var worker = method.Body.CilWorker;
var callMethod = CreateCallInstruction(worker, "WhenLeavingMethod");
var lastInstruction = method.Body.Instructions[method.Body.Instructions.Count - 1];
worker.InsertBefore(lastInstruction, callMethod);
ReplaceJumpToLastInstructionWithJumpToPostInvocationCall(method, lastInstruction, callMethod);
}</p>
Note that the pre-invocation call is added as very first instruction of the method boy whereas the post-invocation call instruction is added as second-last instruction; right before the “ret” OpCode.
Also not the call to the method ReplaceJumpToLastInstructionWithJumpToPostInvocationCall. If inside the method (previous to instrumenting it) there is a jump to the last op code (the ret statement) we have to replace this jump with a jump to our post-invocation call. This can be achieved like this
private void ReplaceJumpToLastInstructionWithJumpToPostInvocationCall(MethodDefinition method, Instruction lastInstruction, Instruction callMethod)
{
var jumpInstructions = method.Body.Instructions.Cast<Instruction>()
.Where(i => i.Operand == lastInstruction);
jumpInstructions.ForEach(i => i.Operand = callMethod);
}</p>
Summary
In this article I have discussed how the Mono Cecil library can be used to instrument an existing .NET assembly and make it ready to be profiled. In the next post I will discuss the gathering and analysis of profiling data.